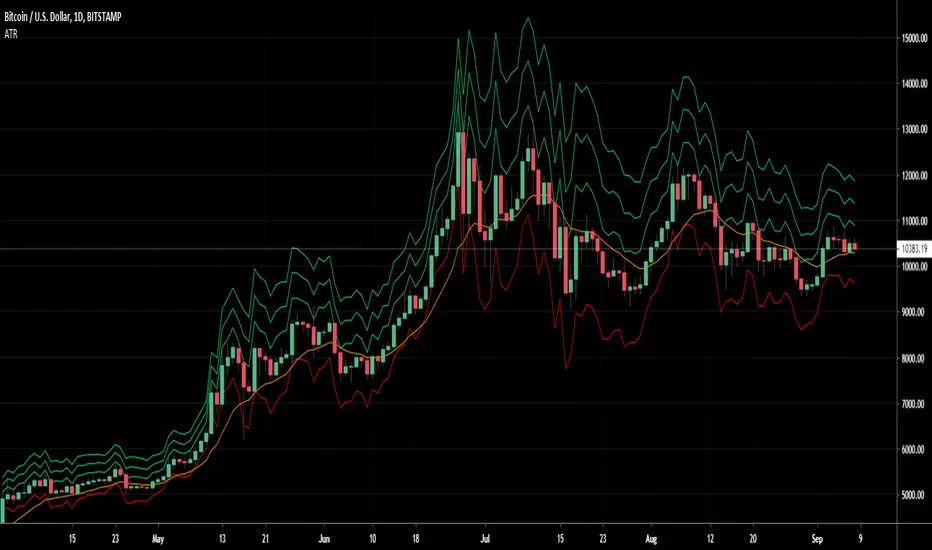
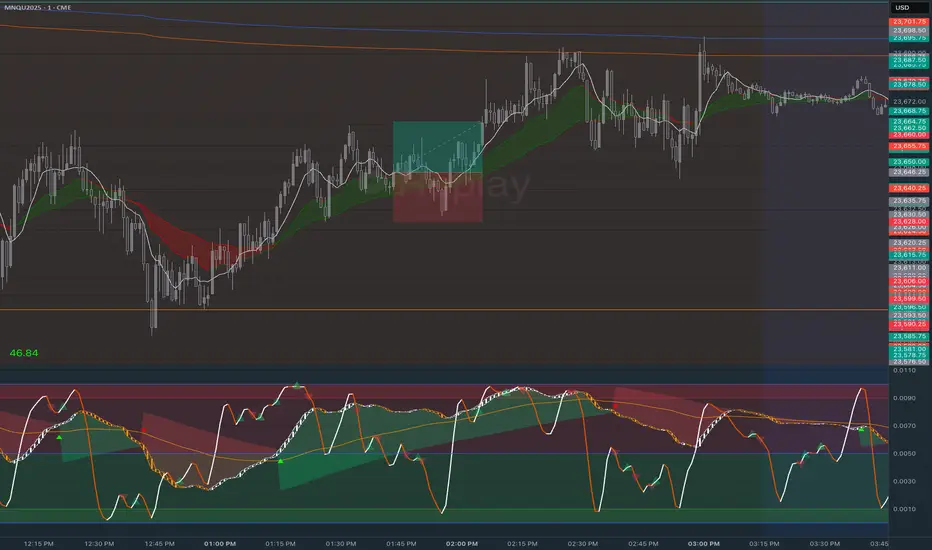
ATR + Momentum Shifts w/Take ProfitThis script is a technical analysis indicator designed to assist in identifying potential entry points and setting take profit levels in trading. It combines the Average True Range (ATR) indicator, momentum shifts, and customizable take profit levels to provide insights into potential market movements.
Differences from Currently Published Ones:
This script is unique due to its use of a combination of elements:
ATR and Momentum: The script combines the ATR indicator to provide dynamic support and resistance levels with the momentum indicator to identify shifts in the underlying momentum.
Customizable Take Profit Levels: It offers the ability to set take profit levels based on customizable multipliers of the ATR, helping traders manage potential profits.
How to Use:
ATR Bands: The script plots upper and lower ATR bands as potential dynamic support and resistance levels.
Shift Arrows: Arrows are plotted below bars for potential long entry opportunities (green triangle) and above bars for potential short entry opportunities (yellow triangle).
Take Profit Levels: The script also plots take profit levels both above and below the source price based on the ATR multipliers set in the inputs.
Markets and Conditions:
This script can be used across various financial markets, including stocks, forex, commodities, and cryptocurrencies. It's most effective in trending markets where momentum shifts can signal potential reversals or continuation of trends. Traders should consider the following conditions:
Trend Confirmation: Look for momentum shifts in the direction of the prevailing trend for higher probability setups.
Volatility: Higher volatility can amplify ATR movements and subsequently affect the placement of ATR bands and take profit levels.
Risk Management: Always implement proper risk management strategies to protect your capital.
Additional Considerations:
Customization: Traders can adjust input parameters like ATR length, momentum length, and take profit multipliers to match their trading style and market conditions.
Combining with Other Indicators: Consider using this indicator in conjunction with other technical indicators or chart patterns for confirmation.
In den Scripts nach "take profit" suchen

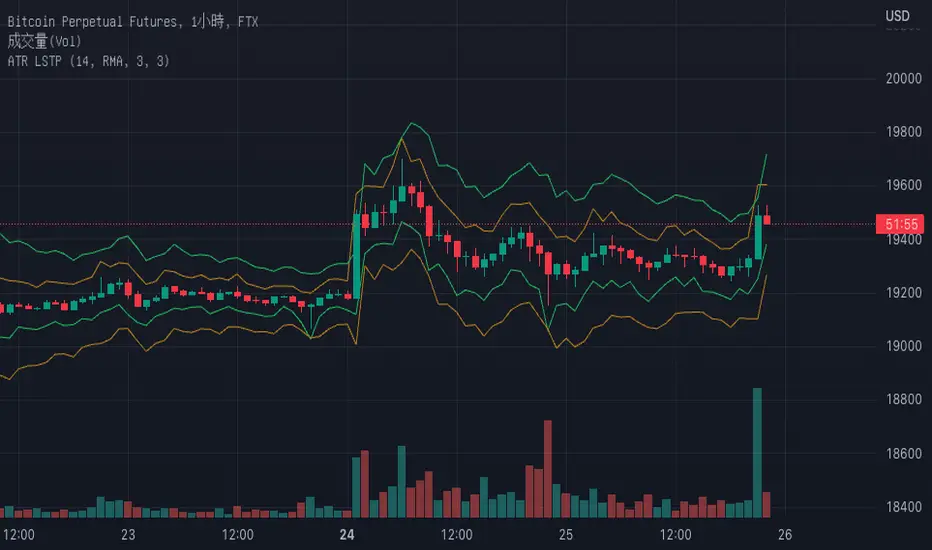
Average True Range with stop loss and take profit finderBased on the official original average true volatility (ATR), two functions have been extended.
Users can see the suggested stop loss and take profit parameters when entering a long or short order with each K-line.
Part of the settings:
Length: The preset is 14 K lines, which can help you grab the suggested stop loss point.
Long-short single profit-loss ratio: After entering the value of the profit-loss ratio (floating point) you want, it will automatically convert and calculate the past take-profit point.
The five values displayed on the chart are from left to right: ATR, Short Stop Loss, Long Stop Loss, Short Take Profit, and Long Take Profit.
ATR Take Profit / Stop Loss [JoseMetal]============
ENGLISH
============
- Description:
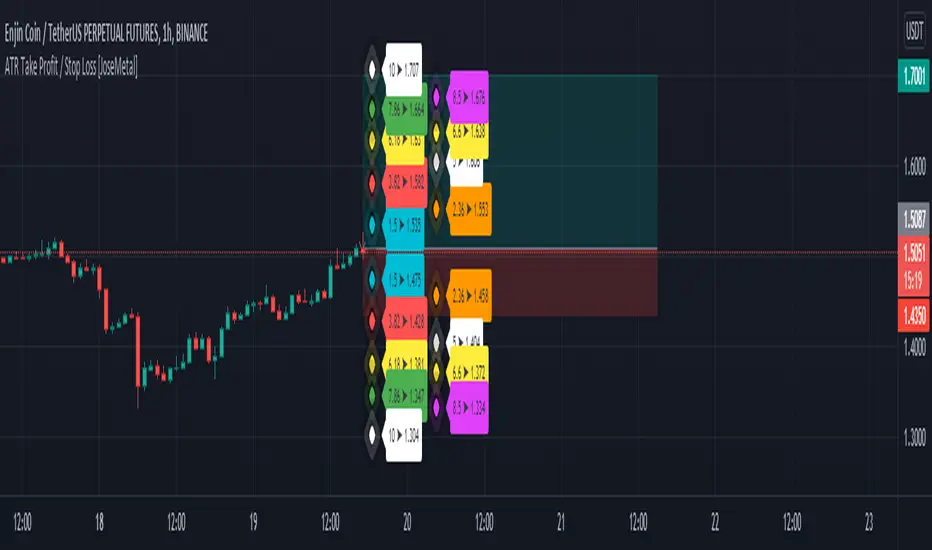
This indicator is based on ATR to print current ATR multiple values for Take Profits or Stop Loss levels, it's real time, so you can use the replay feature to test it or calculate these levels anytime on any candle.
Therefore, levels are calculated by multiplying the ATR by the level multiplier.
- Visual:
Both a "diamond" and label with the ATR multiplier and price value are printed for each level.
Each level has a color for both, diamond and label to make it easier to read.
The levels are split in 2 columns for better visualization.
- Usage and recommendations:
Fibonacci's levels are used for default, but you can customize them as you like.
I usually take 3.82 level (red by default) as stop loss, and I take profit every 2 levels depending on the timeframe, is good to let a small part run until break even or ATR 10 (last level).
- Customization:
Custom ATR period, 10 is default.
Each level has custom multiplier and level.
Customizable offset for diamonds and labels.
Custom precision for prices (because it greatly depends on the asset you're working with).
============
ESPAÑOL
============
- Descripción:
Este indicador se basa en el ATR para mostrar múltiples niveles de Take Profits o Stop Loss, es en tiempo real, por lo que se puede utilizar la función de repetición para probarlo o calcular estos niveles en cualquier momento y en cualquier vela.
Por lo tanto, los niveles se calculan multiplicando el ATR por el multiplicador del nivel.
- Visual:
Tanto un "diamante" como una etiqueta con el multiplicador ATR y el valor del precio se imprimen para cada nivel.
Cada nivel tiene un color tanto para el diamante como para la etiqueta para facilitar su lectura.
Los niveles están divididos en 2 columnas para una mejor visualización.
- Uso y recomendaciones:
Se usan los niveles de Fibonacci defecto, pero puedes personalizarlos como quieras.
Yo suelo usar el nivel 3.82 (rojo por defecto) como stop loss, y tomo beneficios cada 2 niveles dependiendo de la temporalidad, es bueno dejar correr una pequeña parte hasta el break even o ATR 10 (último nivel).
- Personalización:
Periodo ATR personalizable, 10 es el predeterminado.
Cada nivel tiene multiplicador y nivel personalizables.
Desplazamiento (offset) personalizable para los diamantes y las etiquetas.
Precisión para decimales personalizada (porque depende mucho del activo con el que se trabaje).
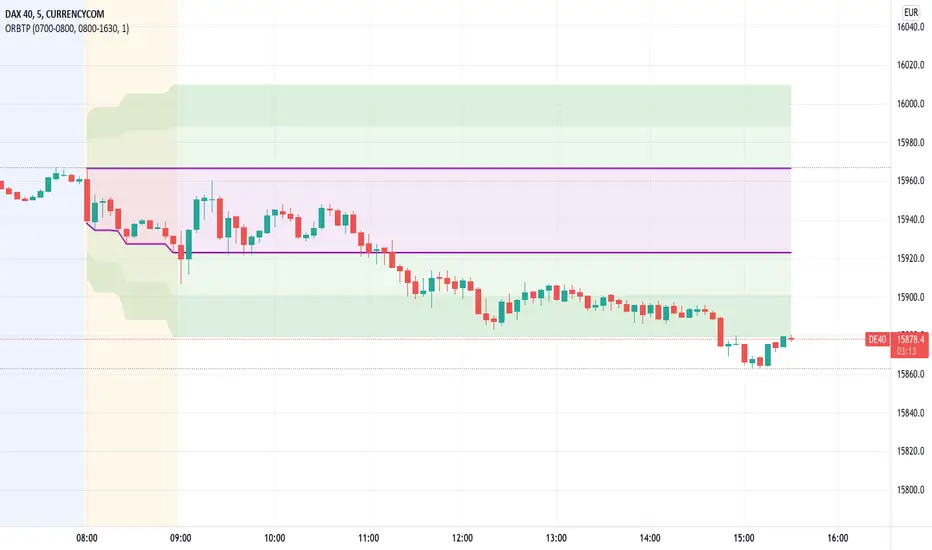
Open Range Breakout With Take Profit Zones
Open Range Breakout With Take Profit Zones prints the open range and profitable zones based on the high and low during the opening hours.
This indicator can be used to prepare breakout trades following the OPR strategy. The time window for the open range as well as for the market hours can be configured. Also custom alerting templates allow to create alerts when a breakout out of the opening range occurs or when 50% take profit level is reached.
The background of pre and post market hours is coloured according to the configured time windows.
This indicator was written to support scalping and day trading. It does not calculate or display results on hourly, daily or weekly charts.
The open range and trading hours must be adjusted to the market time zone of your instrument. Also please take care that these settings are saved on the layout and not per instrument. Eventually create multiple layouts for instruments with different market time zones.
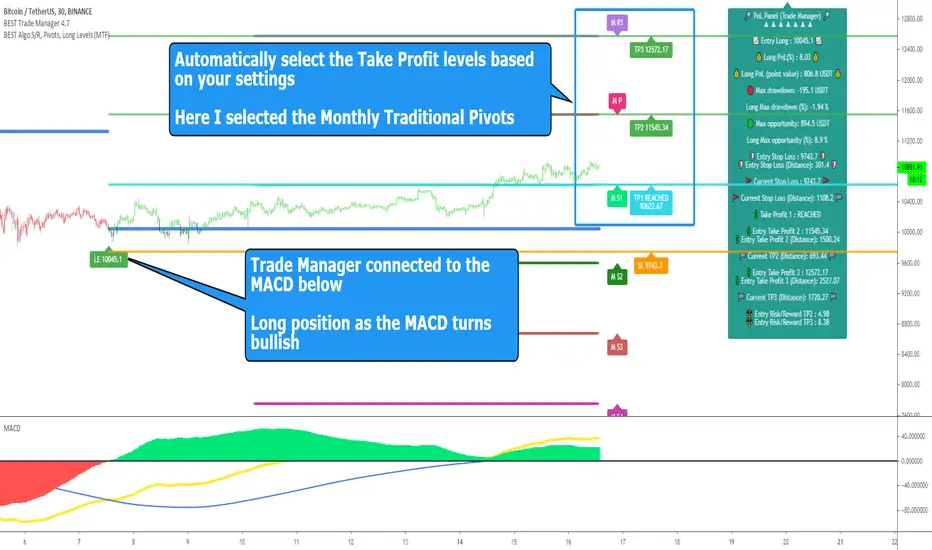
BEST Standalone Trade Manager with Automatic Take ProfitHello BEST traders
The BEST Trade Manager got upgraded with many more features
This version allows setting automatically the TP levels on either Daily/Weekly/Monthly Fibonacci/Traditional/Camarilla/Woodie pivots and Daily/Weekly/Monthly/Intraday Moving Averages
I. 💎 SCRIPTS ACCESS 💎
1. Available only with one-time payment on my website.
2. My website URL is in this script signature at the very bottom (you'll have to scroll down a bit and going past the long description) and in my profile status available here: Daveatt
3. Many video tutorials explaining clearly how all our indicators work are available on your website > guides section.
4. You may also contact me directly for more information
II. 🔎 What is the BEST Trade Manager?🔎
2.1 Concept
The BEST Trade Manager is compatible with any indicator.
Once connected, it adds another layer of good stuff with real-time user custom defined stop loss (8 available options), take profits (4 possible options) + alerts compatible for trading automation.
2.2 How hard is it to update your indicator?
We'll send to our customers, a comprehensive and easy tutorial, to make any indicator compatible.
I guarantee you, it should take no more than 2 minutes per indicator. We made it easy, fun, and awesome. #bolder #statement
III. The amazing benefits of our Plug&Play system
I hope you're ready to be impressed. Because, what I'm about to introduce, is my best-seller feature - and available across many of my indicators.
The BEST Trade manager can be connected to any external indicator
Let's assume you want to connect your RSI divergence to your Trade Manager.
I mentioned an RSI divergence but you may connect any oscillator ( MACD, On balance volume, stochastic RSI, True Strenght index, and many more..) or non-oscillatory (divergence, trendline break, higher highs/lower lows, candlesticks pattern, price action, harmonic patterns, ...) indicators.
THE SKY IS (or more likely your imagination) is the limit :)
Of course, this tool is compatible with my other indicators
We go in-depth on our website why the Plug&Play is an untapped opportunity for many traders out there - URL available on my profile status and signature
IV. 🧰 Features 🧰
Candles can be colored to highlight the trend direction better [/b [
4.1 Stop-Loss Management
For what's following, let's assume that 2 is the stop-loss value you inserted in the indicator, and the Algorithm Builder gives a BUY signal.
This is NOT a recommendation at all, only an example to explain how this feature works.
- %Trailing: The Stop-Loss starts 2% away from the entry price - and will move up (because we're on a BUY trade as per our example) every time your trade will gain 2% profit
- Pips Trailing: Same as above but using a distance in pips/USD value
- Percentage: The Stop-Loss stays static 2% away from the entry price. There is no trailing here
- TP Trailing: Trail your stop-loss every time a Take Profit level is hit
- Supertrend: embedded supertrend use as a trailing stop
- Fixed: Set the Stop-Loss at a fixed position (value should be in currency/units)
- ATR multiple: Set the Stop-loss at a multiple of ATR
- External connector: Let's say your indicator already contains embedded stop-loss levels, you can add them in the Trade Manager
4.2 Take Profits Management
You can manage up to 3 take profit levels defined as a percentage or price value or ATR multiple.
The expected input is in percentage value (for instance, setting the % target of TP1 to 2% will set the TP1 level 2% away from the entry price
This version allows setting automatically the TP levels on either Daily/Weekly/Monthly Fibonacci/Traditional/Camarilla/Woodie pivots and Daily/Weekly/Monthly/Intraday Moving Averages
4.3 Built-in Risk-to-Reward Panel with real-time analytics
The good stuff doesn't stop here.
You'll notice that this sometimes green (when in a LONG), sometimes red (when in a SHORT) panel at the right of your chart.
- Entry Price: the price when the Algorithm Builder will give a signal.
- The Trade PnL in percentage.
- Entry Stop Loss: Distance (in currency/units) between the selected stop-loss algorithm (percent, trailing, TP trailing, etc.) and the entry price.
- Entry TP1/TP2/TP3: Distance (in currency/units) between the entry price and the first take profit
- Risk/Reward TP1/TP2/TP3: Using the Stop-loss distance at entry, and Take Profit 1/2/3 at the entry to compute the risk-to-reward ratio.
- Max drawdown and Max opportunity (value and percentage): respectively the maximum loss and maximum win per trade
For more details, please check the guides section of my website. Links are in my signature and profile status.
V. 🔔 Alerts 🔔
We enabled the alerts on the:
1. Stop-Loss hit
2. Take Profit 1/2/3 hit
3. custom hard exits based on either MACD / RSI divergence/ MM cross
5.1 🤖 Compatible with trading bots? 🤖
It's compatible with all third-parties out there capturing alerts and forwarding them to the brokers.
We enabled TradingConnector and ProfitView alert templates so far.
If you have any doubts or questions, please hit me up directly or ask in the comments section of this script.
BEST regards,
Dave
Trend analysis - Take Profit (Expo)Trend analysis - Take Profit (Expo)
DESCRIPTION
Trend analysis - Take Profit (Expo) indicator is developed to visualize ‘Lock In Profits -points' in trends. It’s a necessity for a professional trader to continuously ‘Lock In Profit’ in order to grow their balance and to reduce their risk. In fact, research shows that exits have more impact on the results than any other factor (Tharp, 2006). So when the indicator shows a ‘TP’ - point, start to lock in some of your profit and continuously do so on every TP - point and exit the trade when a circle is shown.
The indicator does also visualizes the current trend by the color of the cloud. Green color = positive trend. Red color = negative trend.
The professional trader will have the possibility to adjust the sensitivity of the TP - point as well as the length of the trend calculation.
HOW TO USE
1. Use this indicator to identify when to Lock In Profits in trends.
2. Use the indicator to identify trends.
3. Use the indicator to identify a trend shift.
INDICATOR IN ACTION
BTCUSD
BTCUSD
EURUSD
BRENT
EURGBP
The indicator works with RENKO, HEIKIN ASHI and with KAGI charts as well.
I hope you find this indicator useful, and please comment or contact me if you like the script or have any questions/suggestions for future improvements. Thanks!
I will continue to work on this indicator, so please share your experience and feedback with me so that I can continuously improve it. Thanks to everyone that have contacted me regarding my scripts. Your feedback is valuable for future developments!
ACCESS THE INDICATOR
• Contact me on TradingView or use the links below
-----------------
Disclaimer
Copyright by Zeiierman.
The information contained in my scripts/indicators/ideas does not constitute financial advice or a solicitation to buy or sell any securities of any type. I will not accept liability for any loss or damage, including without limitation any loss of profit, which may arise directly or indirectly from use of or reliance on such information.
All investments involve risk, and the past performance of a security, industry, sector, market, financial product, trading strategy, or individual’s trading does not guarantee future results or returns. Investors are fully responsible for any investment decisions they make. Such decisions should be based solely on an evaluation of their financial circumstances, investment objectives, risk tolerance, and liquidity needs.
My scripts/indicators/ideas are only for educational purposes!

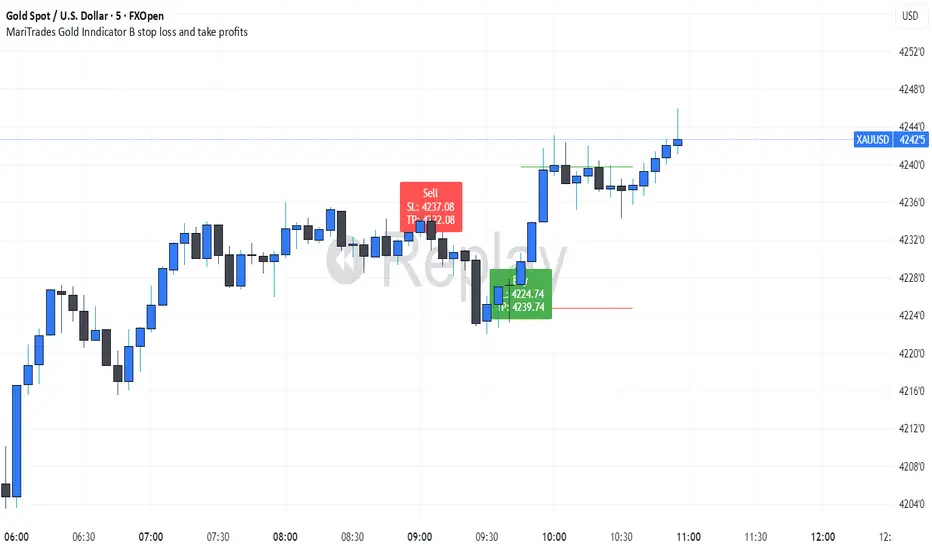
MariTrades Gold Indicator B-Stop loss and Take profitsThe MariTrades Gold Indicator B is an original Trading View script designed to help traders visualize entry points, stop loss (SL), take profit (TP), and key structure levels on gold charts. This publication fully complies with Trading View’s public script rules, including originality, English description, chart clarity, and Pine Script v5 usage.
Key Features:
Break of Structure (BOS) Detection:
Detects trend reversals by identifying when price closes above/below the previous swing high/low.
BOS signals are marked on the chart for both buy and sell opportunities.
Fibonacci Retracement Levels:
Automatically plots retracements from the last swing high to swing low.
(NOT LABELLED)
Entry signals are confirmed when price retraces to these levels after BOS.
Automatic SL and TP Visualization:
Stop loss and take profit levels are drawn directly on the chart.
Default values: SL = 5 pips, TP = 10 pips (customizable via inputs).
Entry Signals:
Buy: Price breaks structure (BOS) and retraces to Fibonacci level → label and lines drawn.
Sell: Price breaks structure (BOS) and retraces to Fibonacci level → label and lines drawn.
Clean, readable chart overlay:
Previous signals are automatically removed to avoid clutter.
SL lines in red, TP lines in green, entry labels clearly displayed.
Dynamic Stop Loss & Take ProfitDynamic Stop Loss & Take Profit is a versatile risk management indicator that calculates dynamic stop loss and take profit levels based on the Average True Range (ATR). This indicator helps traders set adaptive exit points by using a configurable ATR multiplier and defining whether they are in a Long (Buy) or Short (Sell) trade.
How It Works
ATR Calculation – The indicator calculates the ATR value over a user-defined period (default: 14).
Stop Loss and Take Profit Multipliers – The ATR value is multiplied by a configurable factor (ranging from 1.5 to 4) to determine volatility-adjusted stop loss and take profit levels.
Trade Type Selection – The user can specify whether they are in a Long (Buy) or Short (Sell) trade.
Long (Buy) Trade:
Stop Loss = Entry Price - (ATR × Stop Loss Multiplier)
Take Profit = Entry Price + (ATR × Take Profit Multiplier)
Short (Sell) Trade:
Stop Loss = Entry Price + (ATR × Stop Loss Multiplier)
Take Profit = Entry Price - (ATR × Take Profit Multiplier)
Features
Configurable ATR length and multipliers
Supports both long and short trades
Clearly plotted Stop Loss (red) and Take Profit (green) levels on the chart
Helps traders manage risk dynamically based on market volatility
This indicator is ideal for traders looking to set adaptive stop loss and take profit levels without relying on fixed price targets.

Mastering ATR for Smart Stop Loss and Take Profit PlacementUsing the ATR indicator to set Stop Loss and Take Profit levels provides a dynamic and flexible way to manage risk based on the volatility of the market. This method ensures that your SL and TP are always in tune with current market conditions, preventing unnecessary stop-outs while maximizing the potential for profit. The table in the script makes it easy to view your calculated levels directly on the chart, improving your trading efficiency.
If you're looking for a more automated way to manage your trades, integrating ATR-based SL and TP can be a powerful tool in your strategy.
Happy Trading!

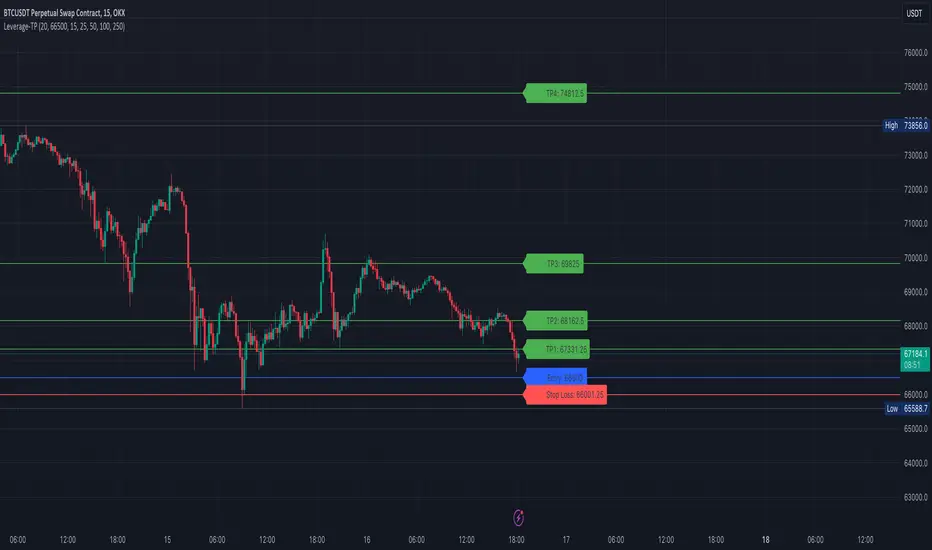
[S1B] Leverage Take-Profit-LinesShort Description:
The Leverage Take-Profit-Lines indicator assists traders in setting take-profit and stop-loss levels based on leverage, entry price, and risk percentage. It draws horizontal lines representing various take-profit levels and the stop-loss level on the chart, aiding traders in visually identifying potential exit points and managing risk.
Detailed Description:
The Leverage Take-Profit-Lines indicator is designed to provide traders with a visual representation of take-profit and stop-loss levels tailored to their leverage, entry price, and risk preferences.
Key Features:
Customizable Parameters: Traders can adjust parameters such as leverage, entry price, risk percentage, and whether to extend lines to suit their trading strategy.
Take-Profit Levels: The indicator calculates and draws horizontal lines representing different take-profit levels based on the specified percentage of leverage-adjusted entry price.
Stop-Loss Level: It calculates and displays the stop-loss level based on the specified risk percentage and leverage, helping traders manage risk effectively.
Visual Representation: The indicator visually highlights take-profit and stop-loss levels on the chart, facilitating quick decision-making for traders.
Usage Guide:
Setting Parameters: Adjust the input parameters including leverage, entry price, risk percentage, and other settings according to your trading strategy.
Interpreting Lines: Horizontal lines are drawn on the chart representing take-profit levels (TP1, TP2, TP3, TP4) and the stop-loss level. These lines indicate potential exit points and risk management levels.
As an example the TP1 can be used to sell 10% of position size, TP2 20%, TP3 20% and TP4 20-40%.
The Leverage Take-Profit-Lines indicator empowers traders with valuable insights into setting profit targets and managing risk effectively, contributing to more informed trading decisions.
ATR Stop Loss and Take Profit FinderThe purpose of this tool is to help the trader determine a safe stop loss price and take profit which dynamically changes due to ATR (Average True Range)
This tool uses the concept of
ATR (Average True Range)
Risk Reward Ratio (Money Management method)
How is ATR Stop Loss and Take Profit Finder working
Step 1 ) Tool will calculate TR(True Range
Step 2) Then the TR will be used to find the Average value of X time frame, using 5 math models: RMA SMA EMA WMA and LSMA
Step 3) The value from Step 2 will be multiplied by the factor, and the result is ATR
After we got ATR Value, the Tool will find 2 lines: Upper Band and Lower Band which will function as a Stoploss value for both Short and Long trade
ATR Stop Loss and Take Profit Finder will be using Upper Band and Lower Band to calculate Take profit price. A trader can set their Target Risk Reward Ratio by setting
How to use ATR Stop Loss and Take Profit Finder
ATR Stop Loss and Take Profit Finder is not an indicator, it is only a tool to help the trader quickly find their stop loss/take profit price. t
For open long position, We comment trade to switch mode of 'Type of open Position to be long. Same as short which is need to be changed to short

Average True Range Take profit (ATR)Average True Range Take Profit
An objective method of determining an initial Take Profit and Stop Loss, based on true market volatility and not arbitrary price levels.
Take Profit Levels and Stop Loss Levels are calculated based on multiples of Average True Range
Features & Functions
Option to switch between long or short
Default Value
Take Profit 1 = 1x ATR.
Take Profit 3 = 2x ATR.
Take Profit 5 = 3x ATR.
Stop Loss 2 = 1.5x ATR.
Basline 13 exponential moving average (EMA) (2)
Extra options ATR
Take Profit 2 = 1,5x ATR.
Take Profit 4 = 2,5x ATR.
Take Profit 6 = 3,5x ATR.
Take Profit 7 = 4x ATR.
Take Profit 8 = 4,5x ATR.
Take Profit 9 = 5x ATR.
Stop Loss 1 = 1x ATR.
Stop Loss 3 = 2x ATR.
Extra options MA
Simple moving average (SMA) (1)
Weighted Moving Average (WMA) (3)
Hull moving average (HMA) (4)
Volume Weighted Moving Average (VWMA) (5)
R moving average (RMA) (6)
Triple exponential moving average (TEMA) (7)
Alpha Net Stop Loss & Take Profit % 🔒 Invite-only Script: Alpha Net SL/TP %
An automated system that plots fixed-percentage Stop Loss and Take Profit zones using EMA 5/32 cross signals. It captures entries, plots TP/SL zones with colored fills, and tracks trade state.
📌 Features:
- EMA 5/32 cross-based entry signals.
- Auto-reset on SL/TP hit.
- Alerts for entry/exit.
- Clean zone visuals.
The code is protected to preserve proprietary logic. Please contact the author to request access.

ATR Take Profit (T-Maker)A dead-simple take-profit helper based on ATR.
This script calculates a 14-period Average True Range (ATR) and multiplies it by a user-defined factor, then shows that single number on your chart in a small table (bottom-left). Use it as a quick, volatility-aware distance for setting take-profit levels, scaling out, or gauging whether a move has “room” to breathe.
What it does
Computes ATR(14) × Multiplier every bar.
Displays the result (rounded to 2 decimals) in a clean on-chart label.
Updates only on the last bar to avoid visual noise and keep performance snappy.
Why it’s useful
Volatility-adjusted targets: ATR adapts to changing market conditions, so your TP distance scales with current volatility.
Instrument & timeframe agnostic: Works on any symbol and timeframe supported by TradingView.
Minimalist workflow: No lines or clutter—just the exact distance to add/subtract from your entry.
How to use it
Choose your ATR Multiplier (default = 4).
Example: If ATR(14) = 1.52 and Multiplier = 4 → displayed value = 6.08.
For a long, a simple TP idea is: TP = Entry + xATR.
For a short: TP = Entry − xATR.
Optionally draw a manual horizontal line at your calculated TP level, or use the value to feed your own rules in other scripts.
Tip: Test different multipliers per market/timeframe (e.g., 2–3 for intraday indices, 3–5 for swing on FX/crypto). Optimize in backtests before going live.
Inputs
ATR Multiplier (int): Scales ATR(14) to your preferred TP distance.
Text Color (color): Customize the display color to match your theme.
Notes & Limitations
Uses ATR(14) (fixed) for consistency in this original version.
Displays a single number only—it does not plot levels, draw lines, or place orders.
Value is rounded to 2 decimals and shown bottom-left of the chart.
Version
v1.0 — Original release (minimal, display-only utility)
Created by T-Maker. This tool is for educational purposes only and is not financial advice. Always manage risk and verify settings before trading.
Stop Loss vs Take Profit Probability and EVThis stop loss and take profit calculator uses a Monte Carlo simulation to calculate the probability of hitting your Stop Loss or Take Profit levels across different time horizons (expressed in bars).
It provides data-driven insights to optimize your risk management and position sizing by showing Expected Value for each scenario.
As a quant, I love using statistical data to help my decisions and get better EV from my trades.
🔬 How It's Calculated
Monte Carlo Simulation: Runs 1,000-10,000 price simulations using a random walk model
Volatility Analysis: Combines ATR-based and Historical Volatility for accurate price movement modeling
Expected Value: Calculates profit/loss expectation using formula: (TP_Probability × Reward) - (SL_Probability × Risk)
Time Horizons: Tests multiple timeframes (1, 5, 10, 20, 50 bars) to find optimal holding periods
Risk/Reward Ratios: Automatically calculates and displays R:R ratios for quick assessment
💡 Use Cases
Position Sizing - Determine optimal risk per trade based on Expected Value
Time Horizon Optimization - Find the best holding period for your strategy
Stop Loss Placement - Validate SL levels using probability analysis
Take Profit Optimization - Set TP levels with statistical backing
Strategy Backtesting - Compare different R:R setups before entering trades
Risk Management - Avoid trades with negative Expected Value
Swing vs Day Trading - Choose timeframes with highest success probability
🎯 How to Use
Setup Trade: Enter your entry price, stop loss, and take profit levels
You can add or remove time horizons denominated in bars. Say you are looking at 1h candles, adding a 24-bar time horizon means you are looking into 24 hours
Choose Direction: Select Long or Short position
Review Table
Analyze Expected Value: Focus on positive EV scenarios (green background)
Optimize Timing: Select time horizons with best risk/reward profile
Adjust Parameters: Modify volatility calculation method and simulation count if needed
Examples
Here's how you can read the tables.
Example 1:
In this chart, we are analyzing the TP and SL probabilities as well as the EV (expected value) for a stock. I want to check what the likelihood is that my SL and TP get triggered over the next 5 days. The stock market is open for 6.5 hours per day, which is 13 bars in this 30-minute bar chart. 26 bars is 2 days, 39 bars is 3 days and so on.
Although this trade is more likely to trigger my SL than my TP, in some of the time horizons we have a positive expected value because of the risk/reward of our trade (i.e. distance of the SL and TP from the price) and the probability of hitting SL and TP.
Example 2:
In this example, we have applied the indicator to gold. Because the TP is much closer to the price, the probability of hitting the TP is much higher.
We can also observe that the expected Value in the shorter time frames is better than in the longer ones. This can give us some clues to set up our trade. If we know that the EV is positive, we can allocate more to that specific trade.
Enjoy, and please let me know your feedback! 😊🥂

Stop Loss & Take Profit For Overlay Indicators[LePasha] Stop Loss & Take Profit For Overlay Indicators
This indicator helps traders easily visualize Stop Loss (SL) and Take Profit (TP) levels based on custom buy and sell signals from any overlay indicators or price-based sources.
Key Features:
Accepts buy and sell signals from any indicator or price source on your chart.
Automatically calculates SL and TP levels using ATR-based volatility for dynamic risk management.
Allows customization of capital, risk percentage per trade, and reward-to-risk ratio.
Displays clear colored boxes on the chart showing potential profit and loss zones.
Calculates position size and required leverage based on your risk settings.
Designed to work with your preferred strategies by simply connecting signal inputs.
Helps you visually manage trades with precise risk control and reward targets.
How to Use:
Connect your buy and sell signals (e.g., from Moving Average crossovers, custom scripts, or price levels) to the indicator’s inputs.
Adjust risk settings to fit your trading style (capital, risk %, reward ratio).
Watch as the indicator draws TP and SL zones on your chart when signals occur.
Use this information to set stops and targets in your trades confidently.
Perfect for traders who want simple, clear, and reliable trade management visuals based on their own strategy signals.

ATR Band, Stop loss , Take Profit Lines, and Pip Distance# ATR Band, Take Profit Lines, and Pip Distance Indicator
This indicator helps traders identify potential stop loss and take profit levels using Average True Range (ATR) bands and custom multipliers. It provides a visual representation of these levels and calculates the pip distance to stop loss, aiding in risk management and trade planning.
## Key Features:
- ATR-based upper and lower bands for potential stop loss levels
- Two take profit levels above and below the ATR bands
- Customizable ATR period and multipliers for bands and take profit levels
- Pip distance calculation to stop loss levels
- Adjustable colors for all elements
## How to Use:
1. The ATR bands (blue and red lines) suggest potential stop loss levels.
2. Take profit levels are shown as green lines above and below the ATR bands.
3. Labels display the pip distance from the current or last close to the stop loss levels.
## Customization:
- Adjust the ATR period and multipliers to fit your trading style
- Customize colors for better visibility on your chart
- Choose between current candle or last close for pip distance calculation
Remember, this indicator is for informational purposes only. Always manage your risk carefully and consider using it in conjunction with other analysis tools and your trading strategy.
Good luck with your trading!

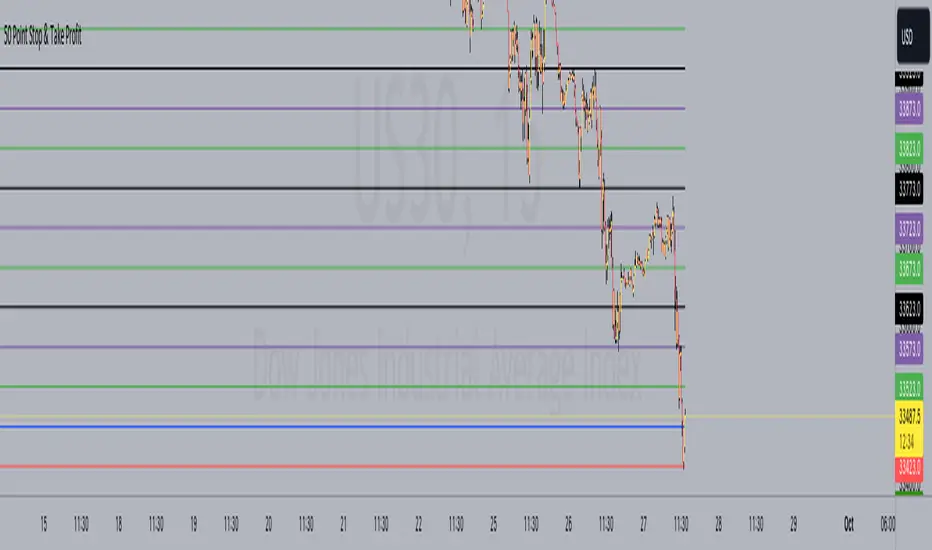
50 Point Stop & Take Profit**50 Point Stop & Take Profit**
This custom TradingView indicator is designed for instruments like US30 or any asset following a point system. It assists traders in setting precise stop-loss and take-profit levels based on different risk-reward ratios. It calculates and plots horizontal lines at various price levels above and below your specified entry price, with a 50-point difference between each ratio.
**How It Benefits Your Strategy:**
- Each risk-reward ratio, whether it's 1:1, 2:1, 3:1, and so on, is separated by precisely 50 points. This deliberate spacing is tailored to provide you with clear and consistent reference points for managing trades in instruments using a point-based system.
- The 50-point increments make it easy to adjust your positions, ensuring that your risk and reward levels align with your trading strategy and objectives.
**Usage:**
1. Set your desired entry price using the "Entry Price" input.
2. The indicator is ideally suited for instruments like US30, where each point represents a distinct price movement. It will automatically calculate and plot multiple lines at the following levels, both for Long (L) and Short (S) positions:
- 1:1 Risk-Reward Ratio (±50 points)
- 2:1 Risk-Reward Ratio (±100 points)
- 3:1 Risk-Reward Ratio (±150 points)
- 4:1 Risk-Reward Ratio (±200 points)
- 5:1 Risk-Reward Ratio (±250 points)
- 6:1 Risk-Reward Ratio (±300 points)
- 7:1 Risk-Reward Ratio (±350 points)
- 8:1 Risk-Reward Ratio (±400 points)
- 9:1 Risk-Reward Ratio (±450 points)
- 10:1 Risk-Reward Ratio (±500 points)
**Customization Options:**
- **Alerts:** You can set alerts for each level to receive notifications when the price reaches a specific risk-reward ratio.
- **Color Customization:** Customize the colors of the plotted lines to suit your chart preferences.
- **Toggle Ratios:** Easily toggle on/off different risk-reward ratios to focus on specific levels that align with your trading strategy.
**How to Use:**
- Use the plotted lines as reference points for setting stop-loss and take-profit orders at your preferred risk-reward ratios.
- The blue horizontal line represents your specified entry price.
This indicator simplifies your trading strategy by providing clear visual cues for managing risk and reward levels, with each level thoughtfully spaced 50 points apart to cater to your strategy's precision.
*Note: Always use risk management and proper trade sizing in your trading strategy.*
**Version:** Pine Script version 5
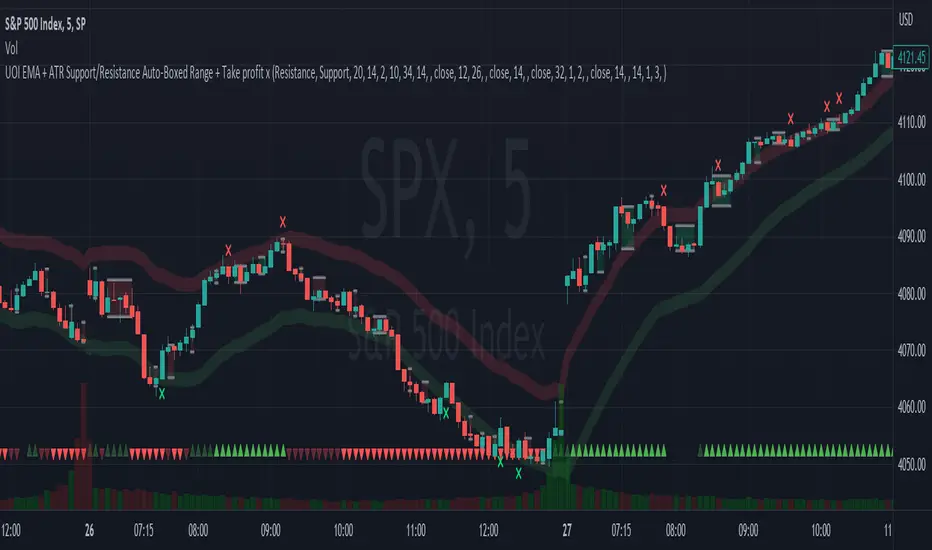
EMA + ATR Support/Resistance Auto-Boxed Range + Take profitUnveiling the 'EMA + ATR Support/Resistance Auto-Boxed Range + Take profit signal' tool, an innovative resource engineered for discerning traders to pinpoint crucial dynamic support and resistance levels (not like the common pivot based support and resistance indictors). The tool ingeniously amalgamates the power of EMA and ATR indicators to delineate these levels as green and red bands, offering invaluable insights into potential trading windows.
The real game-changers in this tool are the newly incorporated 'Auto Boxed Range Detector' and the 'Bull Bear Tug of War' detector. The Auto Boxed Range Detector is at the core of this update, illuminating price ranges to give you the upper hand in detecting breakouts or breakdowns. This feature has been designed meticulously to automate the identification of trading ranges, thereby increasing the accuracy and speed of your decision-making process. Also, this helps avoiding fake breakouts. If the top of the boxed range is near resistance line it is less likely to breakout unless we are on a trend day.
Simultaneously, the Bull Bear Tug of War detector (the little red and green triangles at the bottom) introduces an entirely new dimension of market dominance visualization. This detector embodies market power struggles through vivid red and green triangles, supplemented by translucent colors for transitional periods or potential false-outs. It's a dynamic, real-time pictorial representation of the ceaseless tug of war between bulls and bears captured by a combination of RSI, CCI, MACD, STOCHASTIC, AND VWAP, enabling you to anticipate market swings better. You can change the position of the triangles in the setting and move the red ones to top and keep the green ones in the bottom.
Customization options are plentiful, including the ability to tweak the EMA and ATR lengths, with default values set at 20 and 14 respectively. Additionally, you can modify the ATR multiplier in the S/R length setting, defaulted at 2, and the line width for optimal visibility. The EMA line can be made visible in the settings, while support and resistance lines are color-coded in green and red for instant recognition.
When prices make contact with these levels, the tool generates visual cues in the form of crosses above or below the price bars, thus serving as potential take profit or entry/exit points. Should you prefer, take profit signals can be deactivated in the settings.
To leverage this tool to its maximum potential:
- Fine-tune the EMA and ATR lengths to resonate with your trading strategy. Longer lengths yield smoother lines but may trail current prices.
- Determine the S/R length to govern the spacing of support and resistance lines from the EMA line.
- Stay alert for crosses above or below the price bar, signaling when prices have met support or resistance levels. These are key indicators for potential take profit or entry/exit decisions.
- For best results, this tool should be used in conjunction with other indicators to corroborate signals and minimize false alerts. The ultimate aim is to utilize other indicators to initiate a trade and rely on this tool to provide timely take profit reminders.
Bear in mind, this tool should not be the sole determinant in your investment decisions. Comprehensive research and a multifaceted approach are indispensable when contemplating any trades.
EMA + ATR Support and Resistance + Take Profit SignalThe 'EMA+ ATR Support Resistance Take Profit signal' indicator is a technical analysis tool designed to help traders identify potential support and resistance levels, using the Exponential Moving Average (EMA) and the Average True Range (ATR) indicators. This indicator not only tracks the EMA and ATR but also plots these levels as support and resistance lines, providing useful insights into potential buy and sell points.
The indicator allows you to set the lengths for both the EMA and ATR, with default values set to 20 and 14, respectively. Moreover, you can specify the multiplier for the ATR in the Support/Resistance (S/R) length setting, which defaults to 2. The line width for the plotted lines can also be adjusted according to your preference.
The EMA line in center is invisible by default but you can change that by going to the setting of the indicator. The support and resistance lines are plotted in green and red, respectively. When the price hits the support or resistance levels, the indicator provides a visual signal with a cross shape below or above the respective bars, in lime and red, respectively. If you do not need the take profit signals you can disable them in the setting.
How to Use:
1. Define the EMA and ATR lengths according to your trading strategy. Higher lengths will provide smoother lines but may also lag the current price action.
2. Set the S/R length to determine the distance of the support and resistance lines from the EMA line. Higher values will place these lines further away from the EMA.
3. Monitor the chart for instances when the price hits the support or resistance levels. This is indicated by a cross shape below (for support hit) or above (for resistance hit) the price bar. These points may be considered as potential take profit points or entry/exit points, depending on your strategy.
4. Use the indicator in conjunction with other tools and indicators to confirm signals and reduce the risk of false signals. So the assumption is you enter a trade using your other indicators but you can rely on this indicator to remind you to take profit if you are long by a red cross of the resistance line and if you are short reminds you by a green cross on the support line.
Disclaimer: This indicator should not be used as the sole determinant for any investment decision. Always conduct thorough research and consider multiple factors before trading.

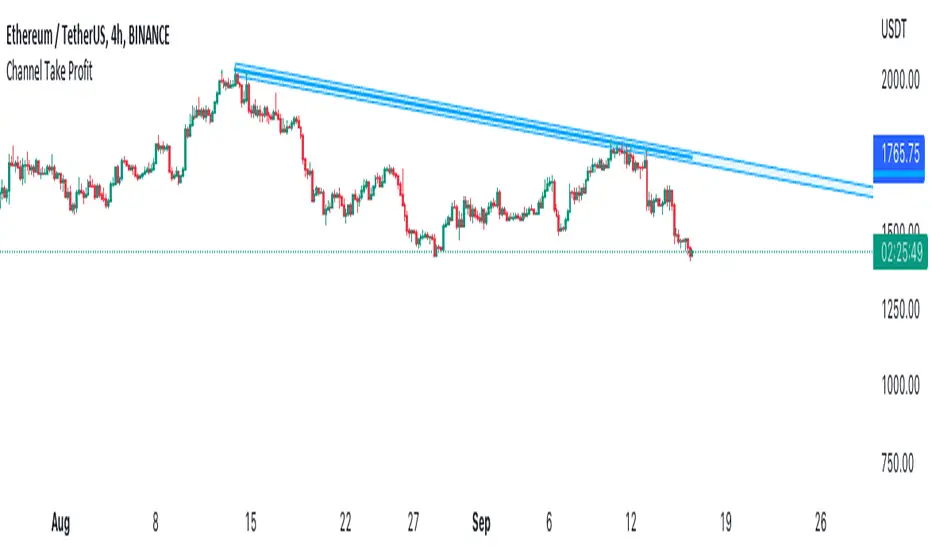
Channel Take Profit Tool for AlertatronWhat is this for
This tool is designed as a companion to an automated strategy running on Alertatron. Sometimes when a strategy opens a trade, you decide that based on TA you would like to close all or or a portion of your trade at a support or resistance level. The strategy may already be programmed to take profit but this tool allows you to add additional take profit criteria that can trigger an alert to Alertatron if it happens before the strategy closes.
How to use it
When you add the indicator to your chart, it will ask you to select two points on the chart. These two points will be connected by a line and create the parallel channel that will be used for triggering a take profit alert. The offset is how wide you want the channel to be. When the high or low of a candle enters the channel from either direction, the alert will be fired. AFTER you add the indicator to the chart and configure ALL of the settings, you need to create an alert on the indicator for "All Alert Functions" and paste your incoming alert webhook from Alertatron into the webhook input.
Alertatron Setup
You will need to provide the API name that you have configured in Alertatron that matches the account the trade is open in. This tool supports ByBit and FTX.us by may work with other exchanges too (this option just chooses which currency/pair divider is used in the alert message).
EMA 200 + Parabolic SAR + RSI + Take Profit Stop Loss By NussaraThe Parabolic SAR is a technical indicator developed by J. Welles Wilder to determine the direction that an asset is moving. The indicator is also referred to as a stop and reverse system, which is abbreviated as SAR . It aims to identify potential reversals in the price movement of traded assets.
EMA 200 ( Exponential Moving Average ) is important because it determines the overall trend, filters a trading system, and reacts faster than the 200 MA.
The relative strength index ( RSI ) is a technical indicator used in the analysis of financial markets. It is intended to chart the current and historical strength or weakness of a stock or market based on the closing prices of a recent trading period. RSI movement above 50 indicates that more traders are buying assets than selling, and are driving the price up. If the RSI moves below 50, it shows that more traders are selling than buying, and are driving the price down.
This indicator uses EMA 200, RSI and parabolic SARS.
The order will be entered when 3 conditions are true
1. First reverse point uptrend of Parabolic SAR
2. The price is close above EMA 200
3. RSI is over 50.
This indicator has a function to take profit and stop loss level.
Stop loss level = First reverse point uptrend of Parabolic SAR .
Take profit level = 1:1.5
This indicator is just a tool for technical analysis . It shouldn't be used as the only indication of trade because it causes you to lose your money. You should use other indicators to analyze together.

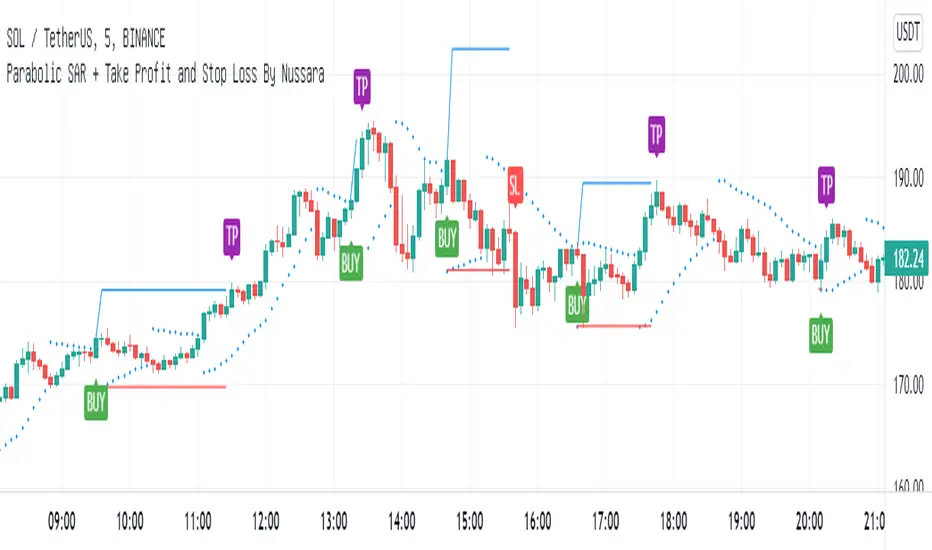
Parabolic SAR + Take Profit and Stop Loss By NussaraThis strategy uses Parabolic SAR. The Parabolic SAR is a technical indicator developed by J. Welles Wilder to determine the direction that an asset is moving. The indicator is also referred to as a stop and reverse system, which is abbreviated as SAR. It aims to identify potential reversals in the price movement of traded assets.
This indicator has a function to take profit and stop loss level.
Stop loss level = First reverse point of uptrend
Take profit level = Entry price + (Entry price-Stop loss level)
User can set a parabolic SARS and a profit point but I fixed stop loss level at first reversals point of uptrend. I also put alert for Buy, Sell, Stop Loss in this indicator.
This indicator is just a tool for technical analysis. It shouldn't be used as the only indication of trade because it causes you to lose your money. You should use other indicators to analyze together.